User Manual
Goal
This user manual should enable you to use the HelloDATA platform and illustrate the features of the product and how to use them.
→ More about the Platform and its architecture you can find on Architecture & Concepts.
Navigation
Portal
The entry page of HelloDATA is the Web Portal.
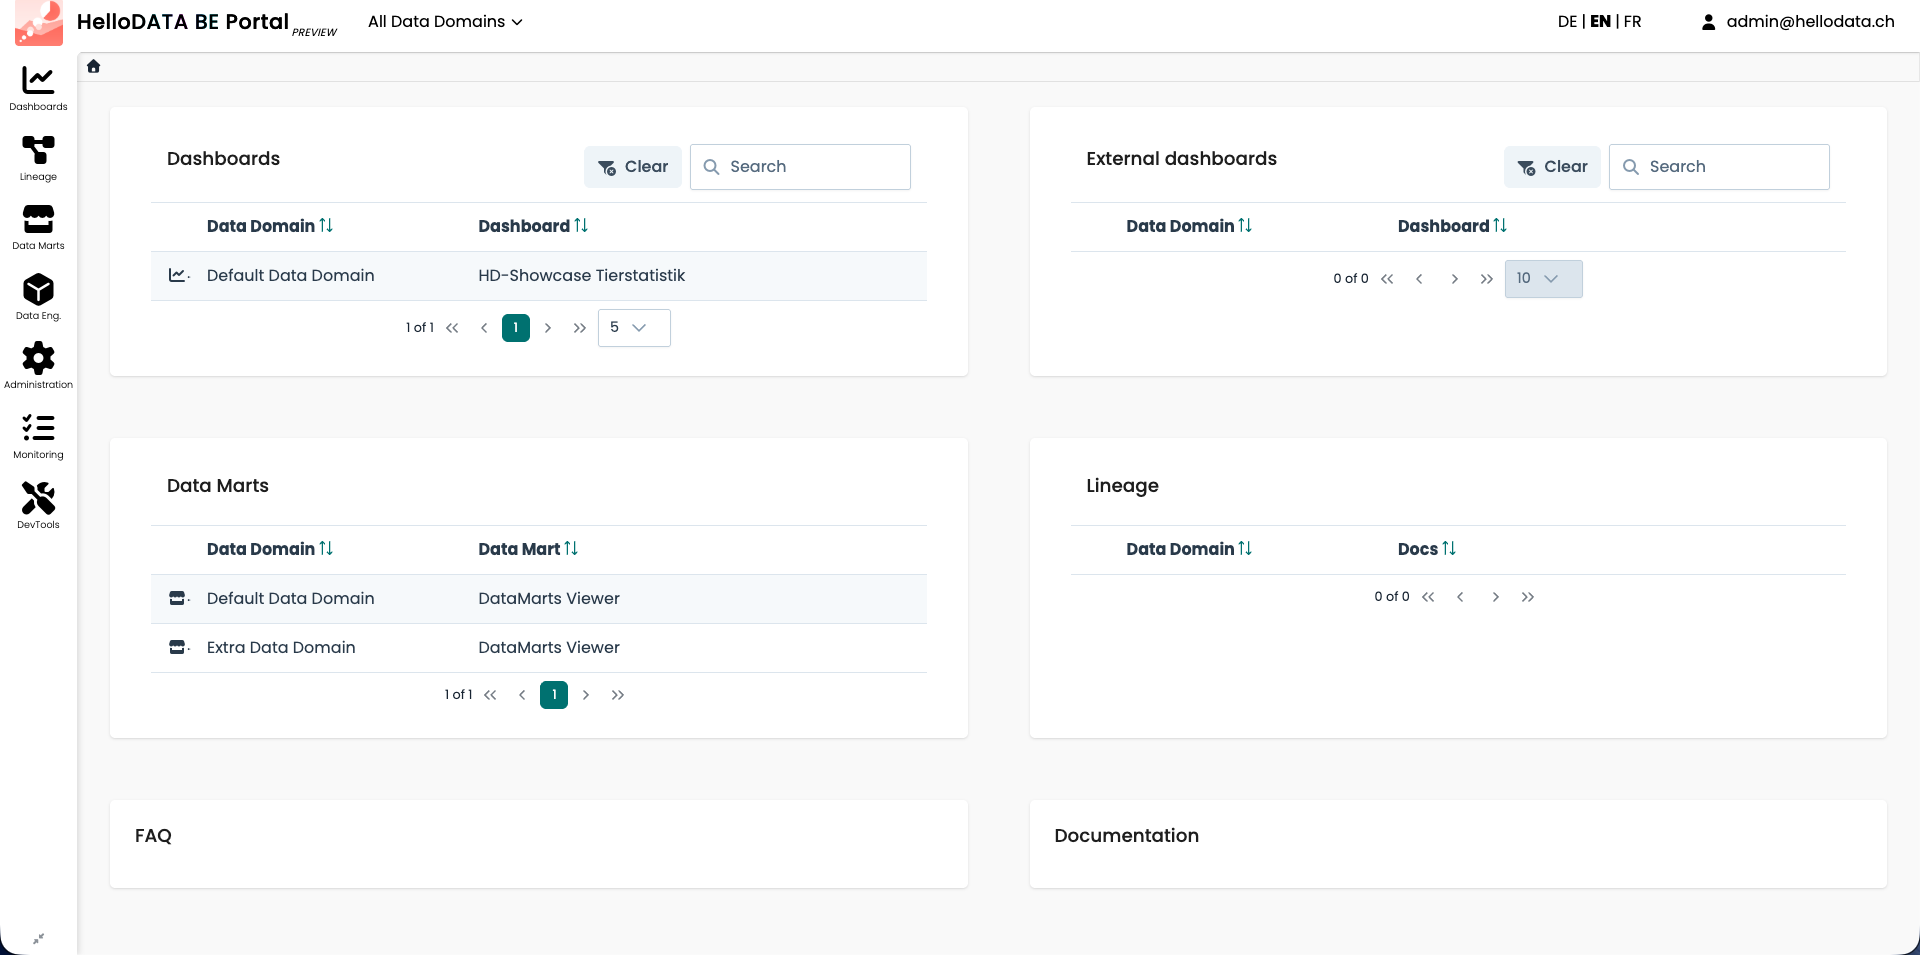
The portal is organized into three areas:
- Icon sidebar (left) – the main navigation. Hovering over an icon expands it and reveals its sub-items. The
available sections depend on your roles and permissions:
- Dashboards – your Superset dashboards and external dashboards
- Lineage – the dbt documentation and data lineage
- Data Marts – the universal data mart (udm) viewer
- Data Eng. – DWH Viewer, Orchestration, Advanced Analytics and the File Browser
- Administration – user, role, dashboard-access, announcement, FAQ and documentation management
- Monitoring – workspaces and subsystem users
- DevTools – queries, mailbox and file browser
- Top bar – the data-domain switcher (
All Data Domains), the language switcher (DE | EN | FR) and the user menu. - Home page – an overview of your dashboards, external dashboards, data marts, lineage docs, FAQ and documentation.
User menu
In the top-right corner the user menu gives you quick access to your Profile, your Notifications, system Info, and Logout.
Business & Data Domain
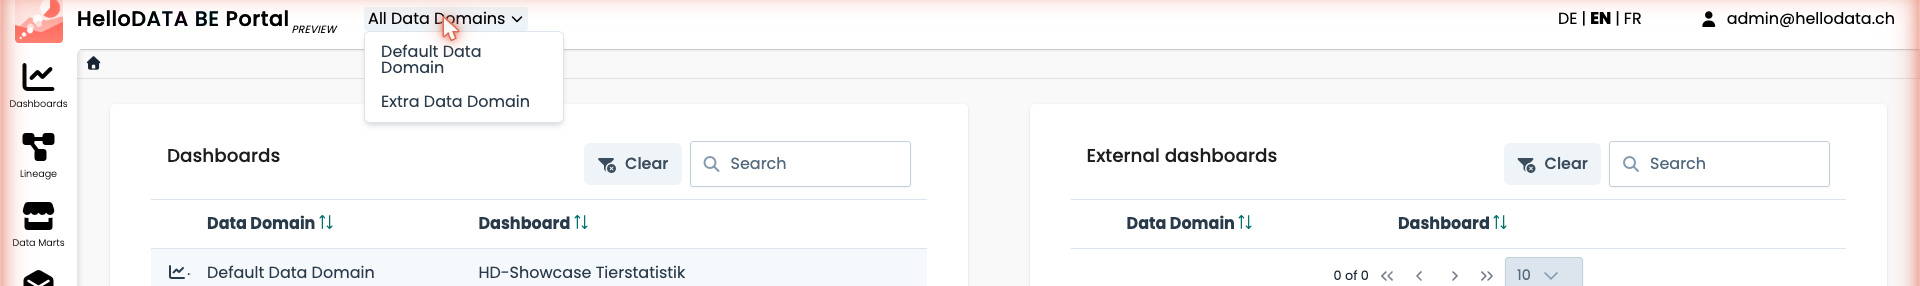
As explained in Domain View, a key feature is to create business domains
with n-data domains. If you have access to more than one data domain, you can switch between them by clicking the
All Data Domains drop-down at the top and selecting the domain you want to work in. Most lists and menus are then
filtered to the selected data domain.
Dashboards
The Dashboards entry in the sidebar is the most important one. Hovering over it reveals the Dashboard List, the dashboards grouped by their Superset instance, the link to open the native Superset instance, the dashboard comments and the external dashboards.
The dashboard list shows all dashboards you have access to, together with their data domain, business process, department, professional responsibility, data analyst and publication status. From here you can open a dashboard, see its details or open it in a new tab.
The overview of your dashboards is also available directly on the home page (see the Dashboards and External dashboards panels in the portal entry page).
Lineage
To see the data lineage (dependencies of your data tables), open the Lineage sidebar entry. You can either pick a specific lineage doc from the hover menu or open the Lineage Docs List to see all dbt documentation projects you have access to.
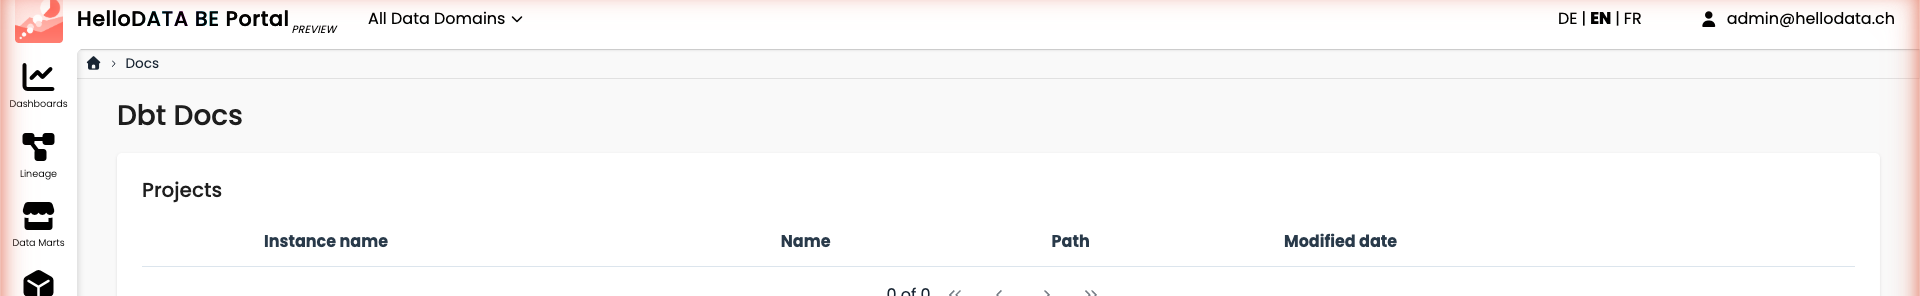
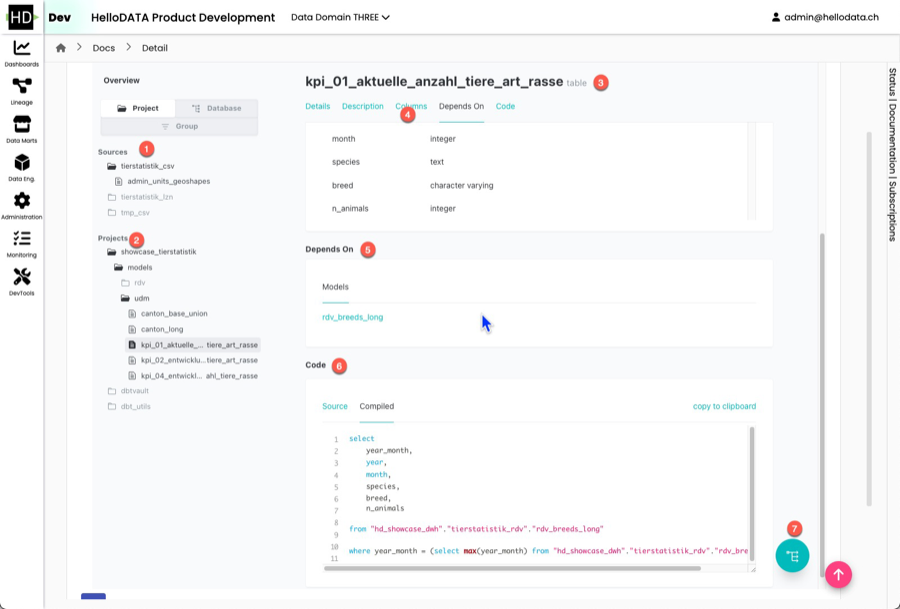
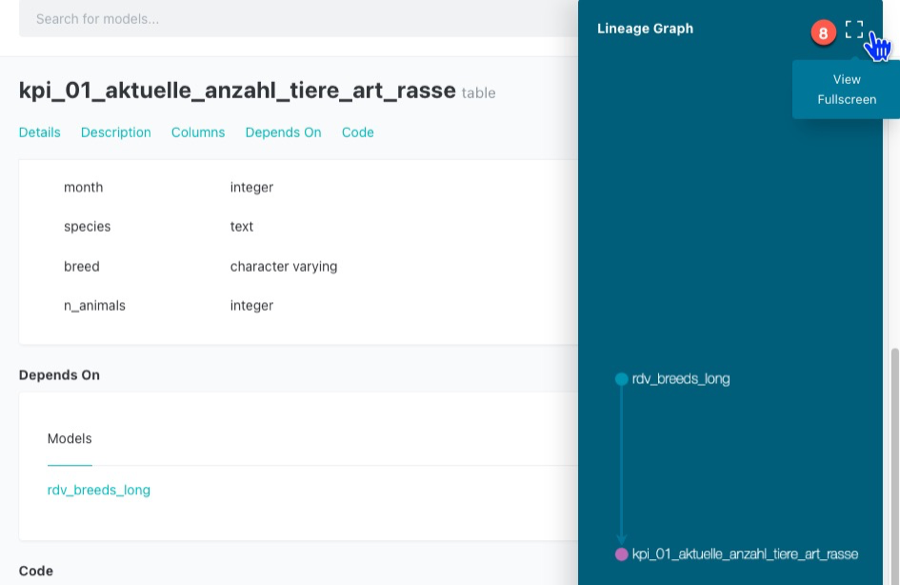
Opening a project brings you to the dbt documentation, where you can see all sources and dbt projects. On the detail page you can see all the beautiful and helpful documentation such as:
- table name
- columns and data types
- which table and model this selected object depends on
- the SQL code
- as a template or compiled
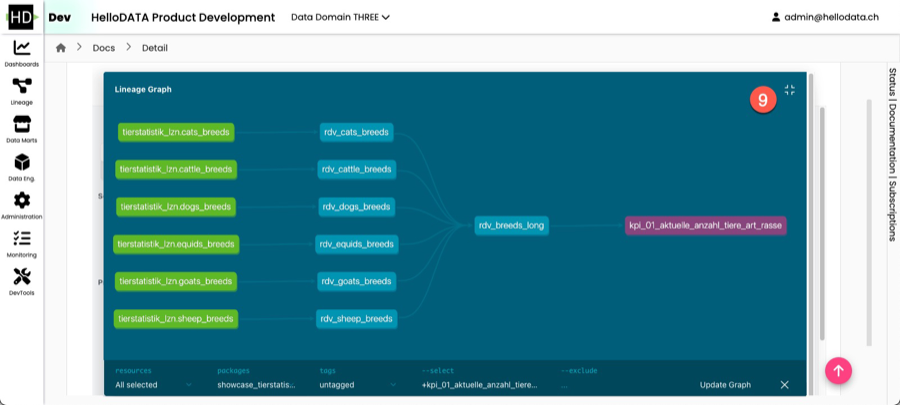
- and the dependency graph
- which you can expand to full view
- interactive data lineage view
Data Marts Viewer
This view lets you access the universal data mart (udm) layer. Open the Data Marts sidebar entry and choose the DM Viewer for the data domain you want to inspect.
These are cleaned and modeled data mart tables. Data marts are the tables that have been joined and cleaned from the source tables. This is effectively the latest layer of HelloDATA BE, which the Dashboards are accessing. Dashboards should not access any layer before (landing zone, data storage, or data processing).
We use CloudBeaver for this, same as the DWH Viewer later.
Data Engineering
The Data Eng. sidebar entry bundles the tools for data engineers: the DWH Viewer, the Orchestration, the Advanced Analytics (JupyterHub) and the File Browser.
DWH Viewer
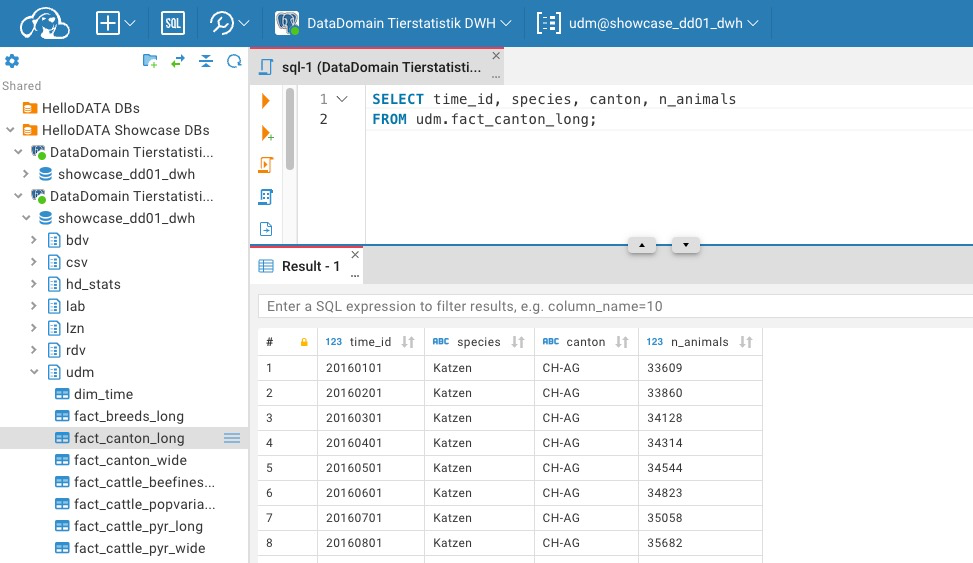
This is essentially a database access layer where you see all your tables, and you can write SQL queries based on your access roles with a provided tool (CloudBeaver).
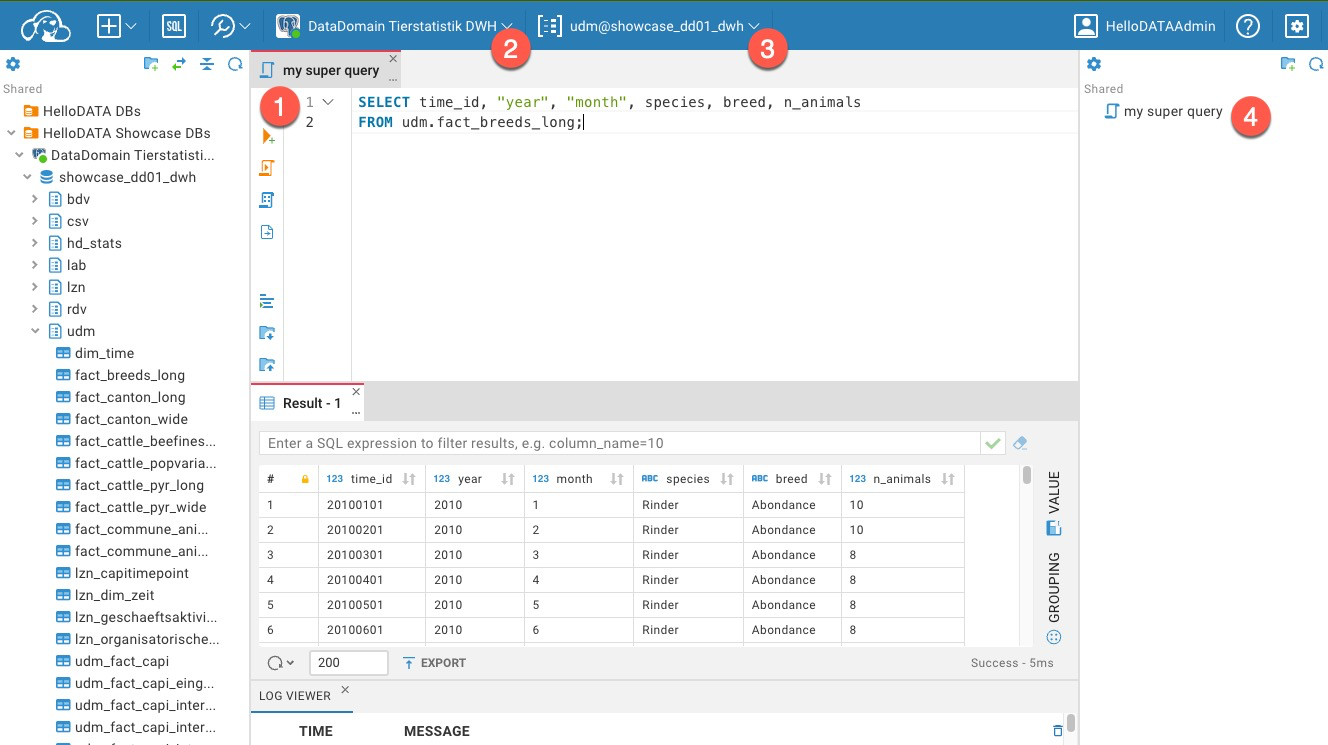
Create new SQL Query
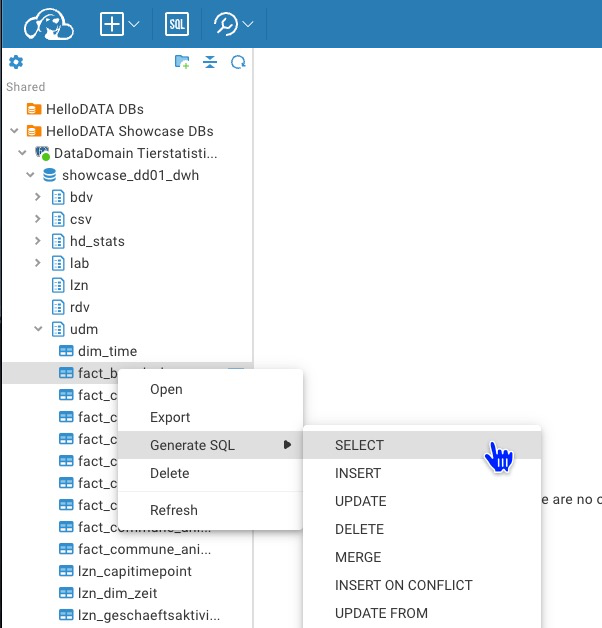
Choose Connection and stored queries
You can choose pre-defined connections and query your data warehouse. Also you can store queries that other user can see and use as well. Run your queries with (1).
Settings and Powerful features
You can set many settings, such as user status, and many more.
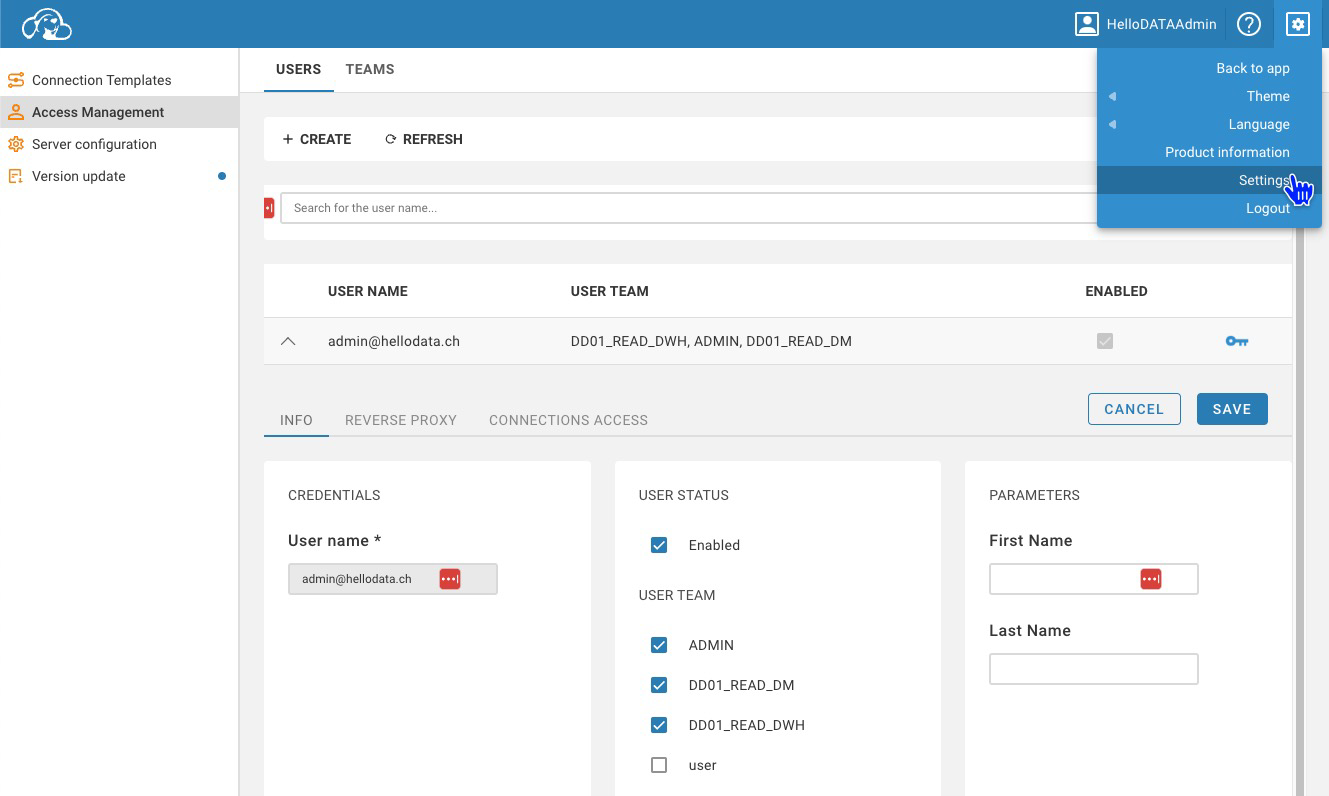 Please find all settings and features in the CloudBeaver Documentation.
Orchestration
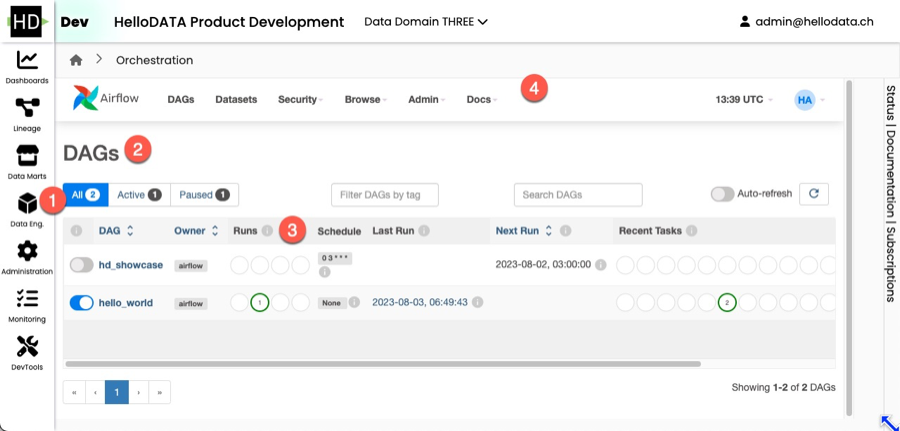
The orchestrator is your task manager. You tell Airflow, our orchestrator, in which order the task will run. This is usually done ahead of time, and in the portal, you can see the latest runs and their status (successful, failed, etc.).
- You can navigate to DAGs and see all the details with the DAG name, owner, runs, schedules, next run and recent.
- You can also dive deeper into Datasets, Security, Admin or similar
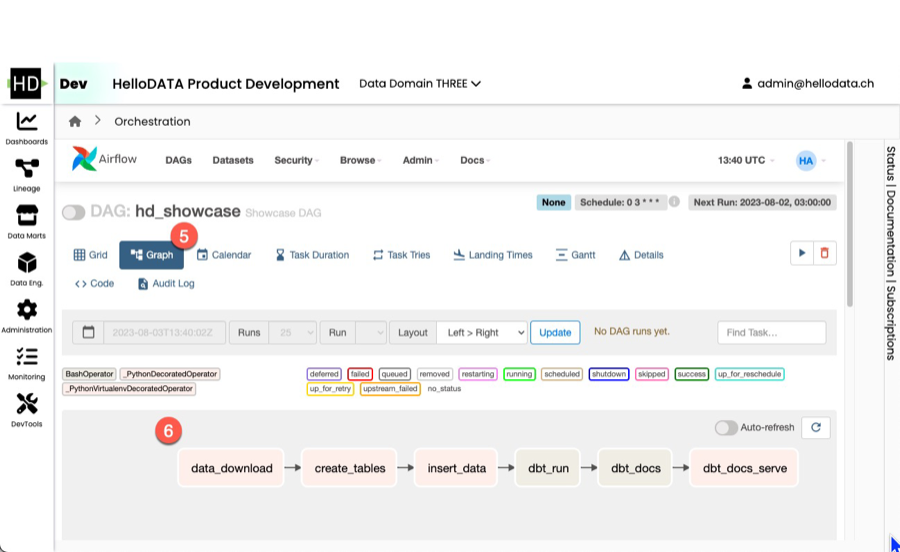
- Airflow offers lots of different visualization modes, e.g. the Graph view, that allows you to see each step of this
task.
- As you can see, you can choose calendar, task duration, Gantt, etc.
Helper Library for Scheduling Jobs on Kubernetes
To unlock the full power of airflow on kubernetes, you will need to run your jobs in containers on the cluster. To make this a bit easier, we provide a preinstalled helper library for you to use.
Library description
The helper library consists mainly of a function, that returns properly formatted parameters to use with Airflow's Kubernetes Pod Operator.
It is named hellodata_be_airflow_pod_operator_params and can be imported with import hellodata_be_airflow_pod_operator_params.
The two public objects are the function get_pod_operator_params and the class EphemeralVolume.
Call the function get_pod_operator_params to get a dictionary with parameters to be passed to kubernetes_pod_operator.
| Parameter | Type | Required | Default | Description |
|---|---|---|---|---|
image |
str |
true |
- | The Docker image to use for the pod |
namespace |
str |
false |
"default" |
The Kubernetes namespace in which to create the pod |
image_pull_secrets |
Optional[List[str]] |
false |
None |
List of image pull secrets for private registries |
secrets |
Optional[List[str]] |
false |
None |
List of Kubernetes secret names to mount in the pod as environment variables |
configmaps |
Optional[List[str]] |
false |
None |
List of Kubernetes configmap names to mount in the pod as environment variables |
cpus |
float |
false |
1.0 |
Number of CPU cores to allocate to the pod |
memory_in_Gi |
float |
false |
1.0 |
Amount of memory in GiB to allocate to the pod |
local_ephemeral_storage_in_Gi |
float |
false |
1.0 |
Amount of local ephemeral storage in GiB to allocate to the pod |
startup_timeout_in_seconds |
int |
false |
120 |
Timeout in seconds for the pod to start up |
large_ephemeral_storage_volume |
Optional[EphemeralVolume] |
false |
None |
Large ephemeral storage volume to allocate to the pod |
env_vars |
Optional[Dict[str, str]] |
false |
None |
Additional environment variables to set in the pod |
| Parameter | Type | Description |
|---|---|---|
name |
str |
The name of the ephemeral volume. |
size_in_Gi |
float |
The size of the volume in GiB (Gibibytes). |
mount_path |
str |
The file system path inside the pod where the volume is mounted. |
storage_class |
str |
The Kubernetes storage class to use for provisioning the volume. |
Example usage
The following python code contains an Airflow DAG that makes full usage of the library to schedule a pod on airflow.
from datetime import timedelta
from pendulum import datetime
from airflow import DAG
from airflow.providers.cncf.kubernetes.operators.kubernetes_pod import (
    KubernetesPodOperator,
)

from hellodata_be_airflow_pod_operator_params import (
    get_pod_operator_params,
    EphemeralVolume,
)  # library import

operator_params = get_pod_operator_params(
    "alpine:latest",
    namespace="my-namespace",
    secrets=["my-secret"],
    configmaps=["my-configmap"],
    cpus=0.5,
    memory_in_Gi=0.5,
    local_ephemeral_storage_in_Gi=1,
    startup_timeout_in_seconds=10 * 60,
    large_ephemeral_storage_volume=EphemeralVolume(
        "my-storage", 5, "/app/large_ephemeral_storage", "my-storage-type"
    ),
    env_vars={"key": "value"},
)

default_args = {
    "owner": "airflow",
    "depend_on_past": False,
    "start_date": datetime(2025, 8, 1, tz="Europe/Zurich"),
}

with DAG(
    dag_id="example_dag",
    schedule="@once",
    default_args=default_args,
    max_active_runs=1,
    dagrun_timeout=timedelta(minutes=60 * 5),
) as dag:

    my_task = KubernetesPodOperator(
        **operator_params,
        name="my_task",
        task_id="my_task",
        arguments=[
            """
    echo "I run on kubernetes and have the following env vars" &&
    printenv
    """
        ],
    )
Default DAG: HelloDATA Monitoring
This is a DAG provided by us that gives you a summary of DAG runs. It will send you an email reporting which DAGs have failed since the monitoring DAG last ran, which have run successfully, which have not run and which are still running.
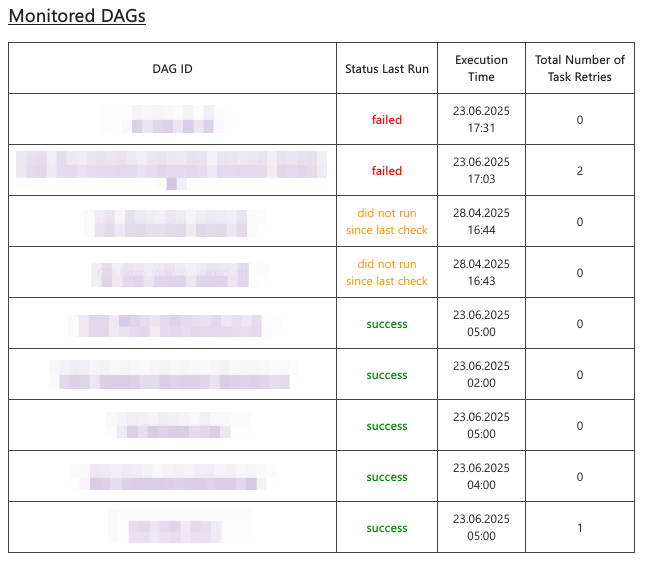
The email contains three sections:
1. Monitored DAGs – A table with an overview of DAG runs tagged as monitored.
2. Changes to DAGs – Lists DAGs that have been paused/unpaused, are new, deleted, newly monitored (added the monitored tag) or newly unmonitored.
3. General Overview – A table with all DAG runs.
You can modify the behavior of the DAG using environment variables on the Airflow worker:
| Variable Name | Default Value | Effect |
|---|---|---|
MONITORING_DAG_STATE_FILE |
/opt/airflow/dag_state_cache.json |
Path to a file where the state is saved. On Kubernetes, this could be on a PVC to ensure it persists after a pod restart. |
MONITORING_DAG_NOTIFY_EMAIL |
moiraine@tarvalon.org,rand.althor@aielwaste.net |
Comma-separated list of email addresses to send the report to. Airflow's mail server settings are used for sending the email. |
MONITORING_DAG_AIRFLOW_LINK |
your administrator has forgotten to set the MONITORING_DAG_AIRFLOW_LINK env variable |
Value used to generate direct links to the DAG runs. |
MONITORING_DAG_INSTANCE_NAME |
HelloDATA |
Used to generate the email title: <MONITORING_DAG_INSTANCE_NAME> monitoring, <date and time> - DAG monitoring report. |
MONITORING_DAG_RUNTIME_SCHEDULE |
0 5 * * * |
Cron expression for when to run the DAG. |
Prebuilt Mechanism for logging DAG runs
HelloDATA offers an easy way to log your DAG run stats to your DWH database through the log_dag_run function in the
preinstalled python package hellodata_be_dag_logs. The library is opensource, of course. You can have a look at the code
on GitHub.
log_dag_run function
The log_dag_run function logs statistics for all tasks in the current Airflow DAG run,
excluding any specified task IDs, and inserts this data into a database table.
This helps in monitoring and analyzing DAG performance over time.
Return type: None
The function does not return a value; it performs logging and database insertion as side effects.
These are the input parameters.
| Parameter | Type | Default Value | Usage |
|---|---|---|---|
kwargs |
dict[str, Any] |
required | Airflow context dictionary containing information about the current DAG run. |
exclude_task_ids |
list[str] |
[] |
List of task IDs to exclude from logging and database insertion. |
connection_id |
str |
"default_connection" |
Airflow connection ID used to connect to the target database. |
schema_name |
str |
"public" |
Name of the database schema where the task statistics table resides. |
table_name |
str |
"dag_runs_stats" |
Name of the table where task statistics will be inserted. |
Notes
- Ensure your Airflow connection (
connection_id) is correctly configured for your database. - The function should be called after the DAG run to capture accurate statistics.
- Adjust parameters as needed for your environment.
- You might want to ignore the task that logs the stats for the logs (see parameter
exclude_task_ids)
Example usage
The following example demonstrates how to use the log_dag_run function within an Airflow DAG. It defines several simple tasks and a logging task that records DAG run statistics to a database. The logging task is configured to run after the main tasks, ensuring that all relevant information is captured.
import pendulum
from airflow.decorators import dag, task
from hellodata_be_dag_logs import log_dag_run

@dag(
    schedule=None,
    start_date=pendulum.datetime(2021, 1, 1, tz="UTC"),
    catchup=False,
    tags=["example"],
)
def tutorial_taskflow_api():
    @task(task_id="dt1")
    def dt1():
        return "Some dummy task 1"

    @task(task_id="dt2")
    def dt2():
        return "Some dummy task 2"

    @task(task_id="dt3")
    def dt3():
        return "Some dummy task 3"

    @task(task_id="dt4")
    def dt4():
        return "Some dummy task 4"

    @task(task_id="hd_log_dag_run", provide_context=True)
    def log_stats(**kwargs):
        log_dag_run(
            kwargs,
            connection_id="your-connection-id",
            schema_name="udm",
            table_name="dag_run_stats",
            exclude_task_ids=["hd_log_dag_run"],
        )

    dt1_task = dt1()
    dt2_task = dt2()
    dt3_task = dt3()
    dt4_task = dt4()
    print_context_task = log_stats()
    dt1_task >> dt2_task
    [dt2_task, dt3_task] >> print_context_task

tutorial_taskflow_api()
Advanced Analytics (JupyterHub)
If you have one of the roles of HELLODATA_ADMIN, BUSINESS_DOMAIN_ADMIN, or DATA_DOMAIN_ADMIN, you can access
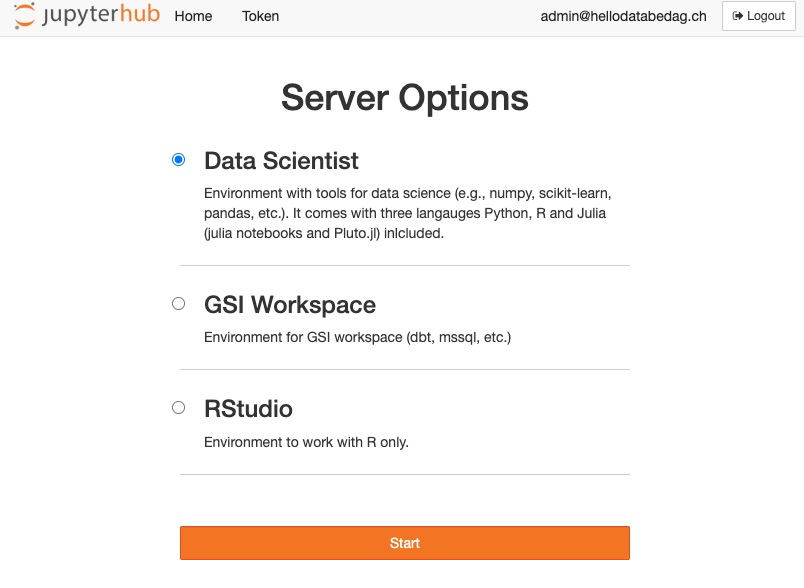
Advanced Analytics from the Data Eng. sidebar entry. It opens JupyterHub for the selected data domain.
That opens up JupyterHub where you choose the base image you want to start with. E.g. you choose Data Science to do ML workloads, or R if you solely want to work with R. This could look like this:
After you can start creating notebooks with File -> New -> Notebook:
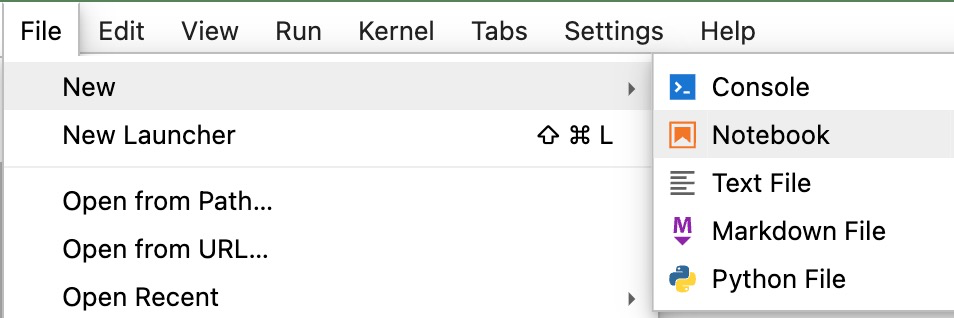 After you choose the language (e.g. Python for Python notebooks, or R).
After you can start running commands like you do in Jupyter Notebooks.
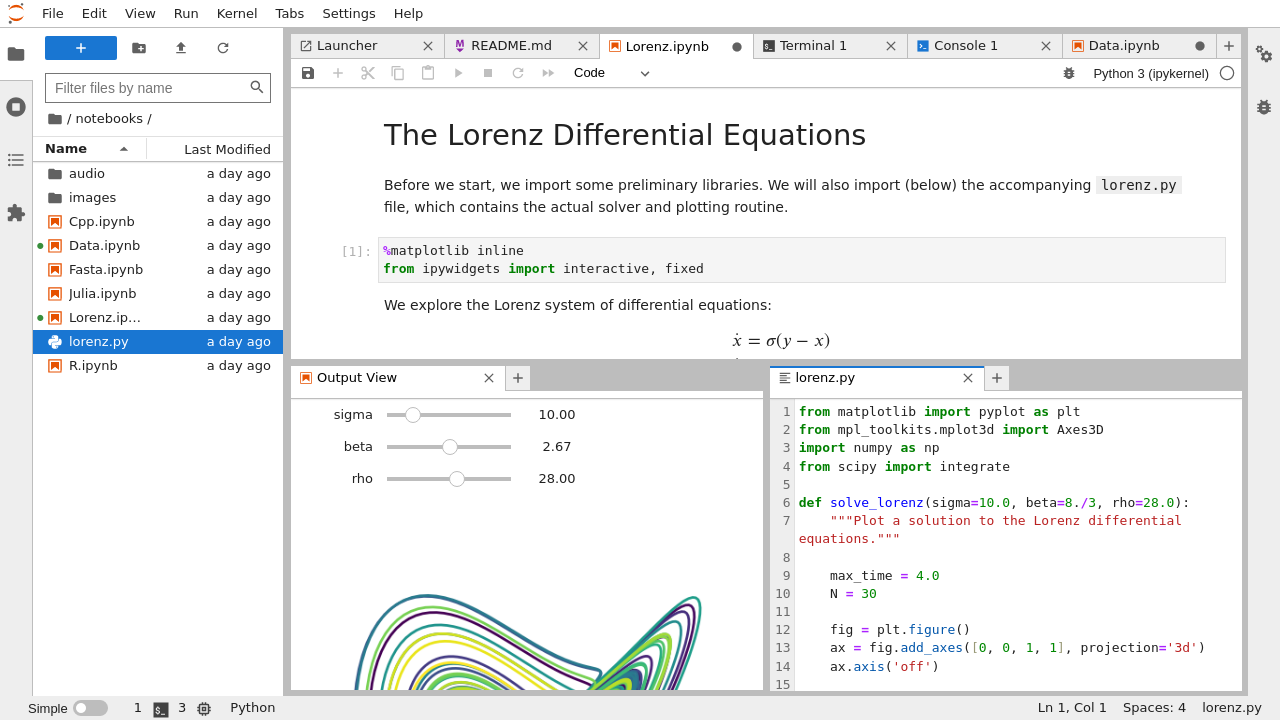
See the official documentation for help or functions.
Connect to HD Postgres DB
By default, a connection to your own Postgres DB can be made.
The default session time is 24h as of now and can be changed with ENV
HELLODATA_JUPYTERHUB_TEMP_USER_PASSWORD_VALID_IN_DAYS.
How to connect to the database
This is how to get a db-connection:
from hello_data_scripts import connect # import the function
connection = connect() # use function, it fetches the temp user creds and establishes the connection
connection can be used to read from postgres.
Example
This is a more extensive example of querying the Postgres database. Imagine SELECT version(); as your custom query or
logic you want to do.
import sys
#import psycopg2 -> this is imported through the below hello_data_scripts import
from hello_data_scripts import connect

# Get the database connection
connection = connect()

if connection is None:
    print("Failed to connect to the database.")
    sys.exit(1)

try:
    # Create a cursor object
    cursor = connection.cursor()

    # Example query to check the connection
    cursor.execute("SELECT version();")
    db_version = cursor.fetchone()
    print(f"Connected to database. PostgreSQL version: {db_version}")

except psycopg2.Error as e:
    print(f"An error occurred while performing database operations: {e}")

finally:
    # Close the cursor and connection
    cursor.close()
    connection.close()
    print("Database connection closed.")
Administration
Here you manage the portal configuration such as users, dashboard groups, dashboard access, roles, announcements, FAQs, and documentation. Hover over the Administration sidebar entry to see all available sub-items.
User Management
The User management page is the central place to invite users, synchronize them and manage their permissions.
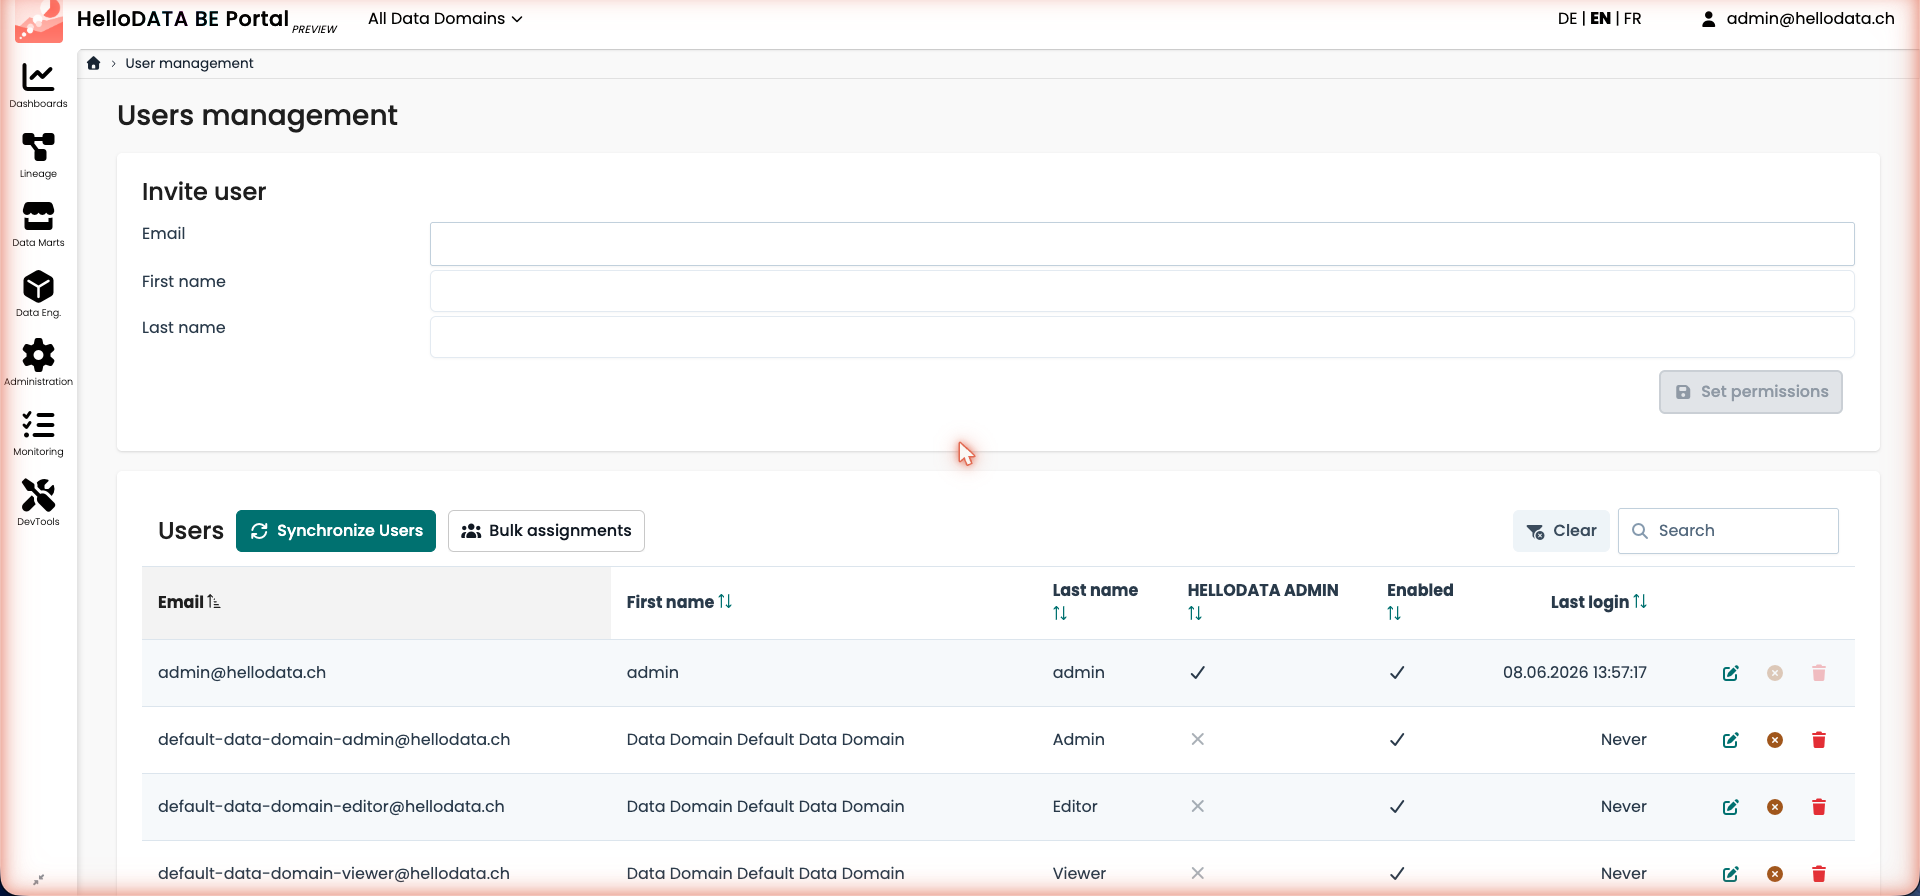
Inviting a user
Fill in the Email, First name and Last name in the Invite user panel and click Set permissions to create the user and continue to the permission assignment.
Synchronizing users
The Synchronize Users button reconciles the portal users with the identity provider (Keycloak) and the connected subsystems.
Changing permissions
In the Users table you can search for a user and use the action icons on the right of each row to edit the user,
enable/disable it or delete it. The edit icon opens the user's role and data-domain assignment, where you choose the
role to grant and the specific data domains to give access to.
See more in role-authorization-concept.
Bulk Assignments
For assigning roles, dashboards, and dashboard groups to multiple users at once, use the Bulk Assignments wizard (reachable from the Users table). See the dedicated Bulk Assignments guide for a full walkthrough.
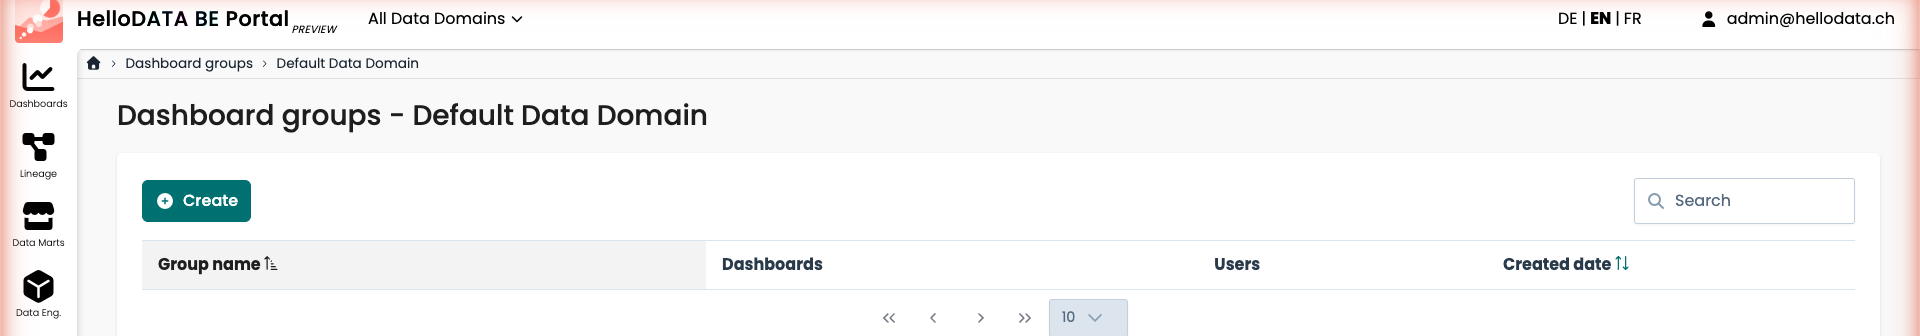
Dashboard Groups
Dashboard groups let you bundle dashboards and grant access to a set of users at once, per data domain. Select the data domain under Dashboard groups and use Create to define a new group with its dashboards and users.
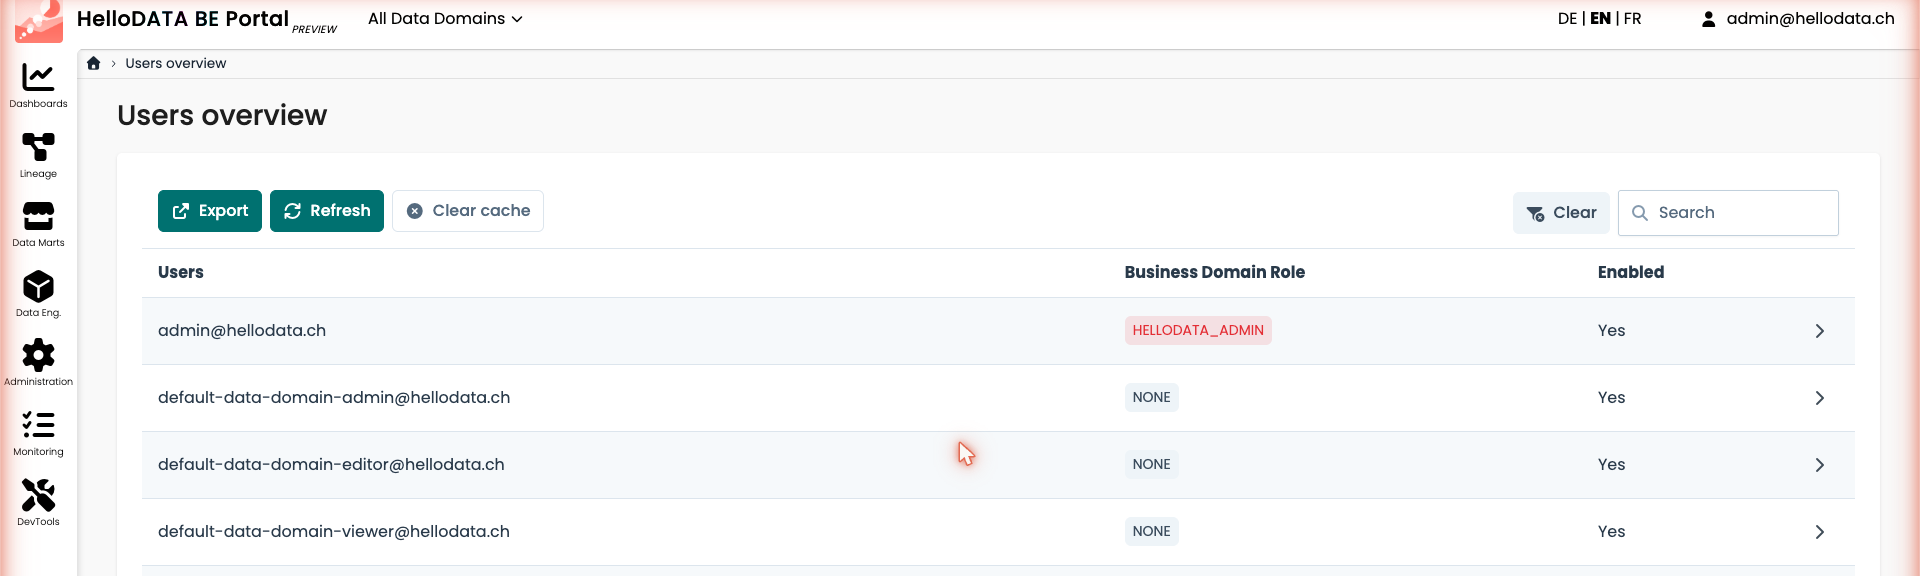
Users Overview
The Users overview gives you a consolidated, read-only view of all users and their business-domain role across the platform. You can Export the list, Refresh it, or Clear cache to force a re-fetch. Expand a row to see the detailed role assignments per context.
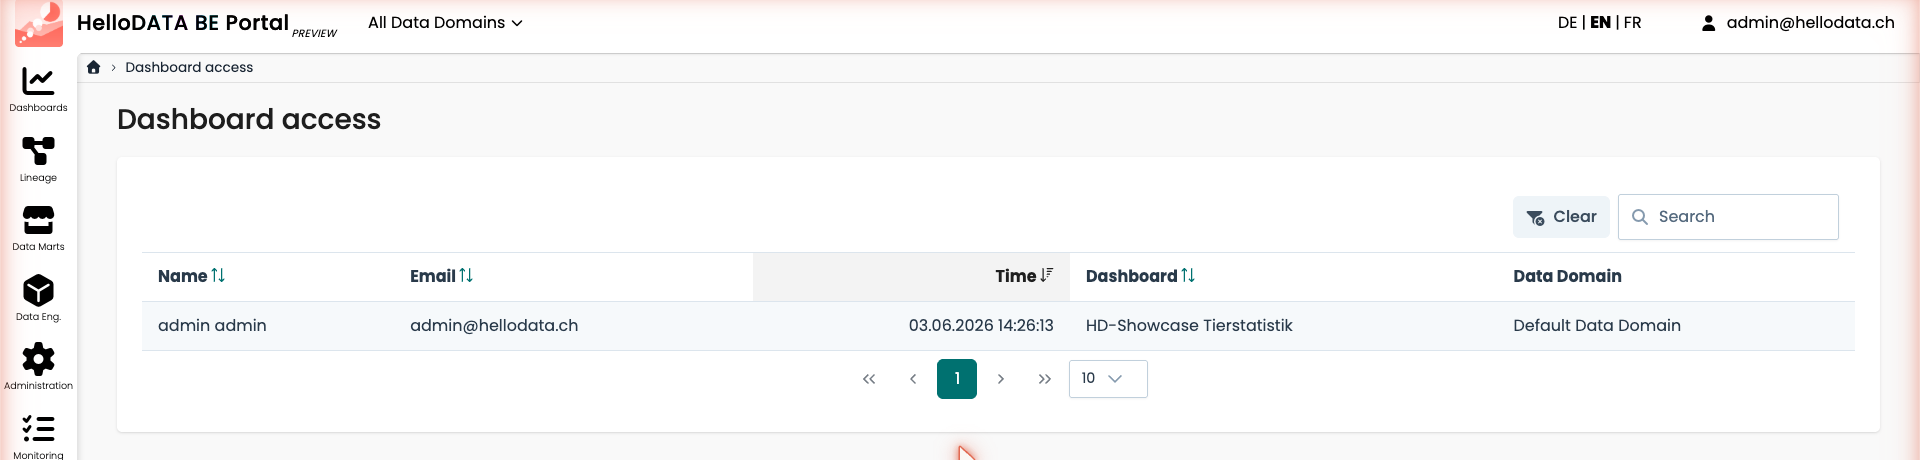
Dashboard Access
The Dashboard access page is an audit log that shows which user accessed which dashboard and when, including the data domain. Use the search box to filter the log.
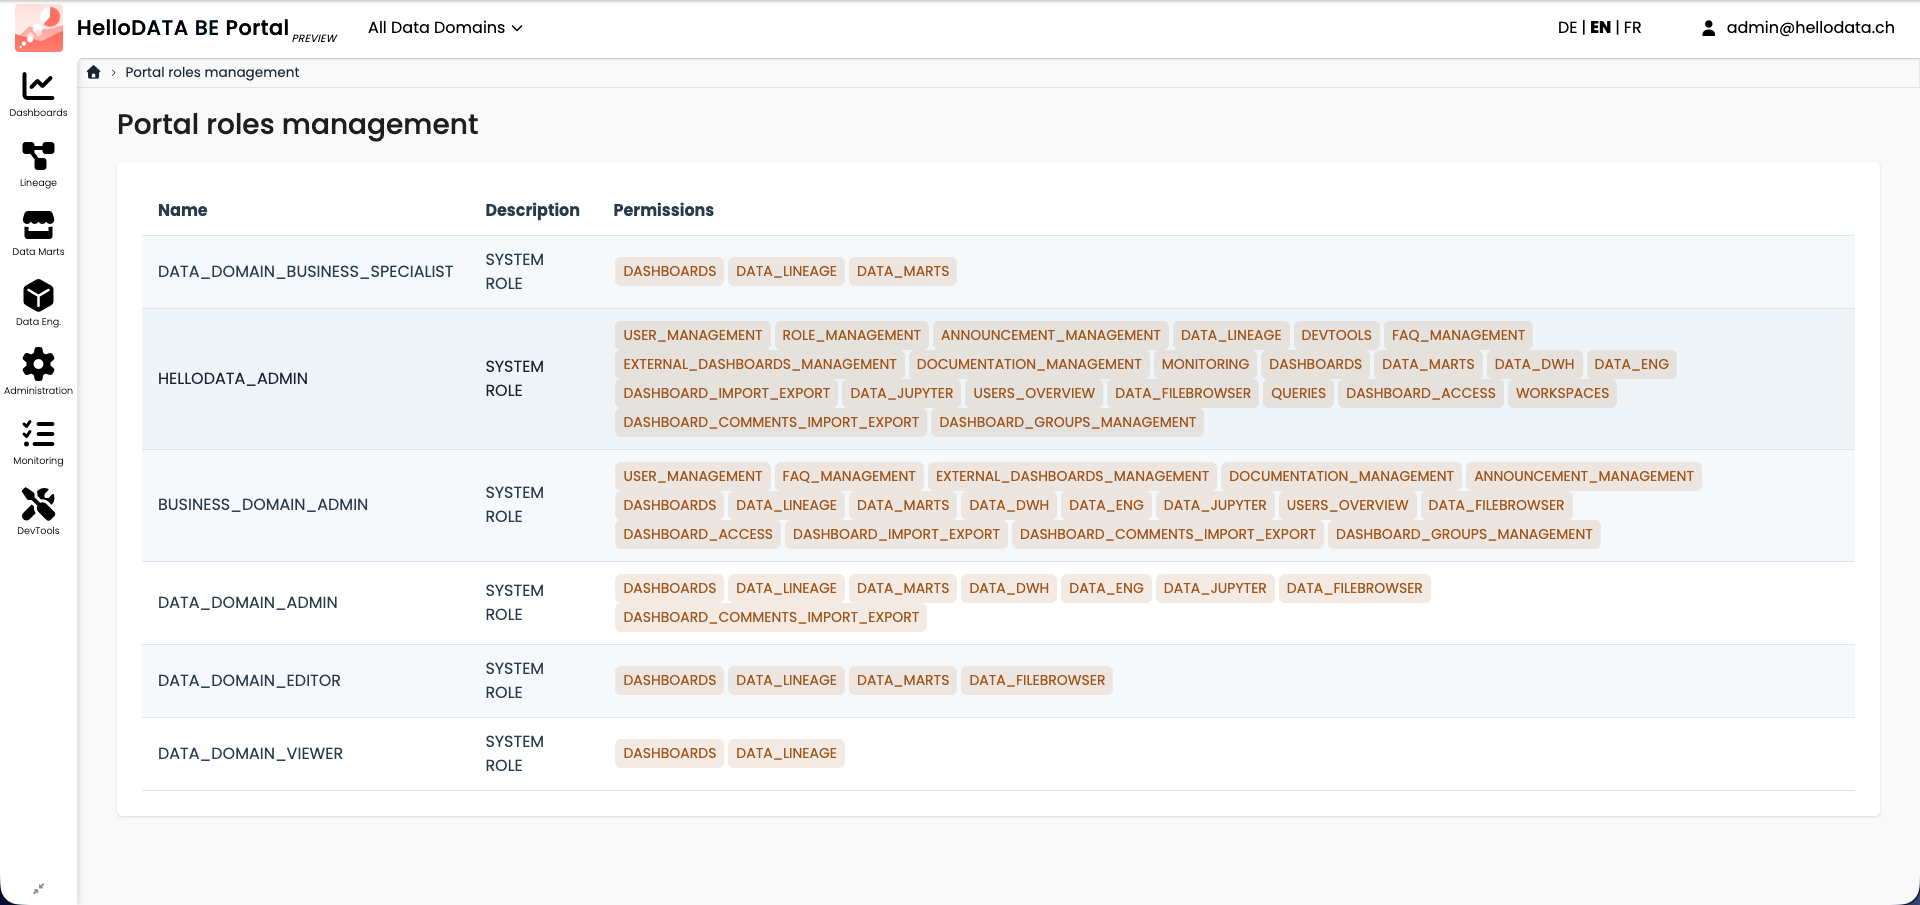
Portal Role Management
In Portal role management you can see all the roles that exist together with their permissions.
Warning
Creating new roles is not supported. All roles are system roles and are defined and hard coded.
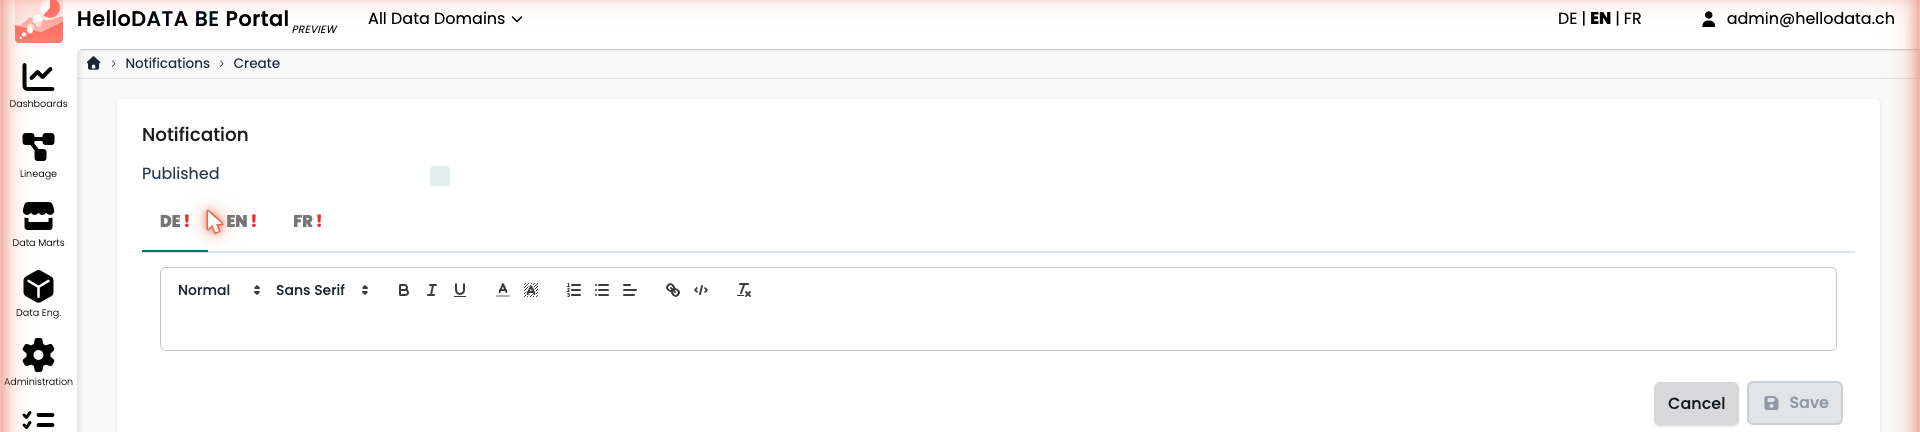
Announcements
You can create an announcement (notification) that is shown to all users. Open Announcements and click Create. The editor is multilingual — provide the text for DE, EN and FR using the rich-text editor, then toggle Published and Save. Published announcements appear at the top of the portal until the user closes them.
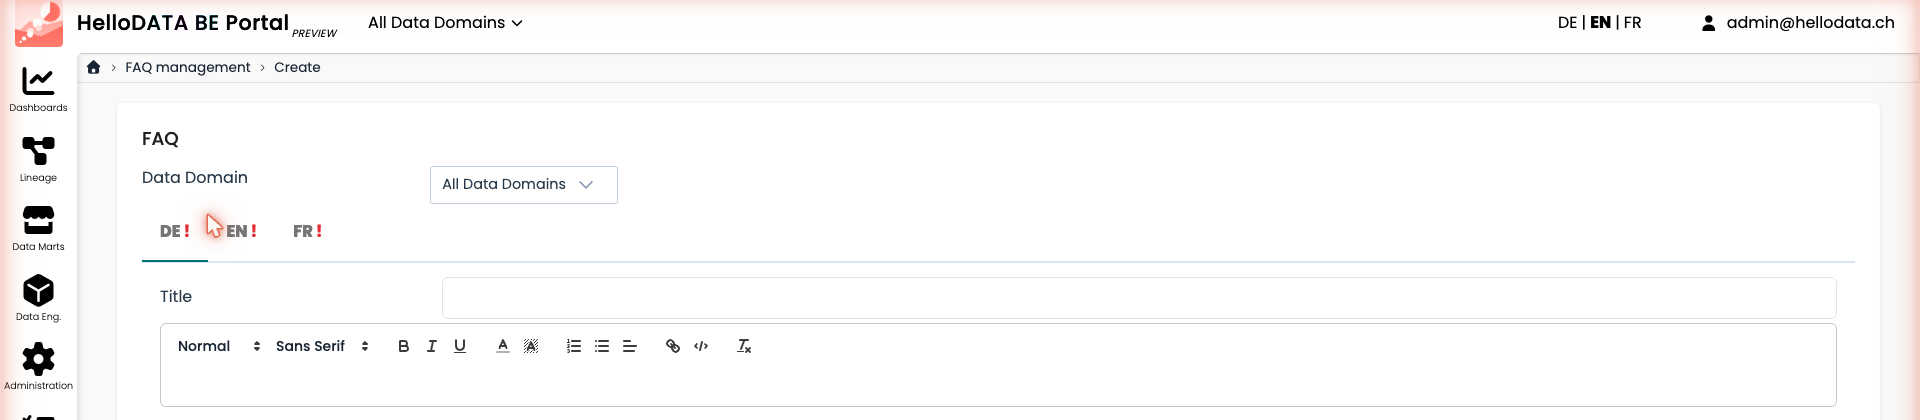
FAQ
The FAQ works similarly to the announcements. Open FAQ management, click Create, choose the Data Domain the FAQ should apply to (or All Data Domains), enter a Title and the content for each language. FAQs are shown on the home page.
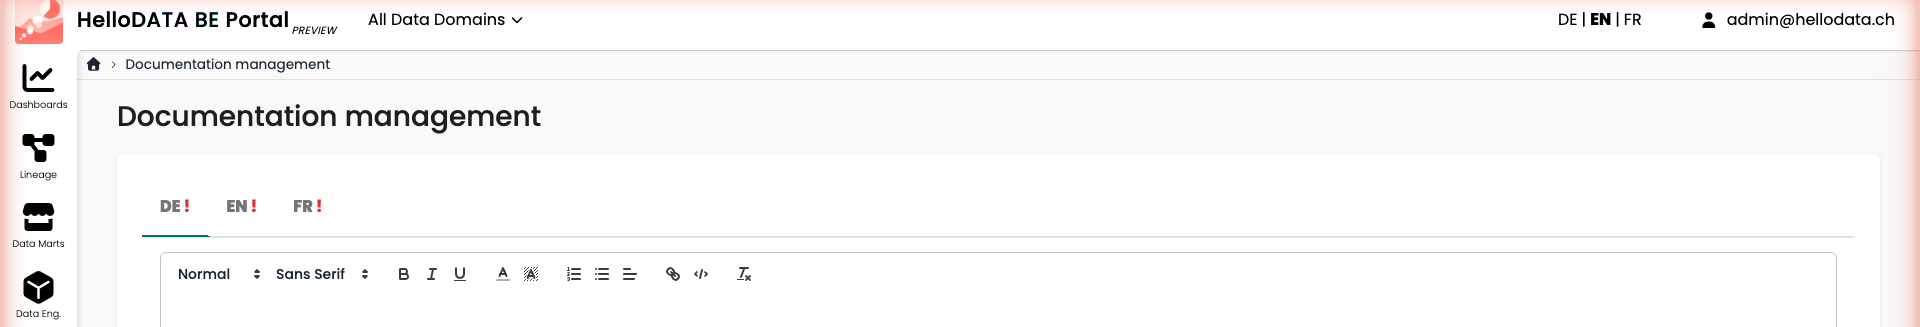
Documentation Management
With Documentation management you maintain a single documentation entry that everyone with the permission can edit. The editor is multilingual (DE / EN / FR) and the content is shown on the home page.
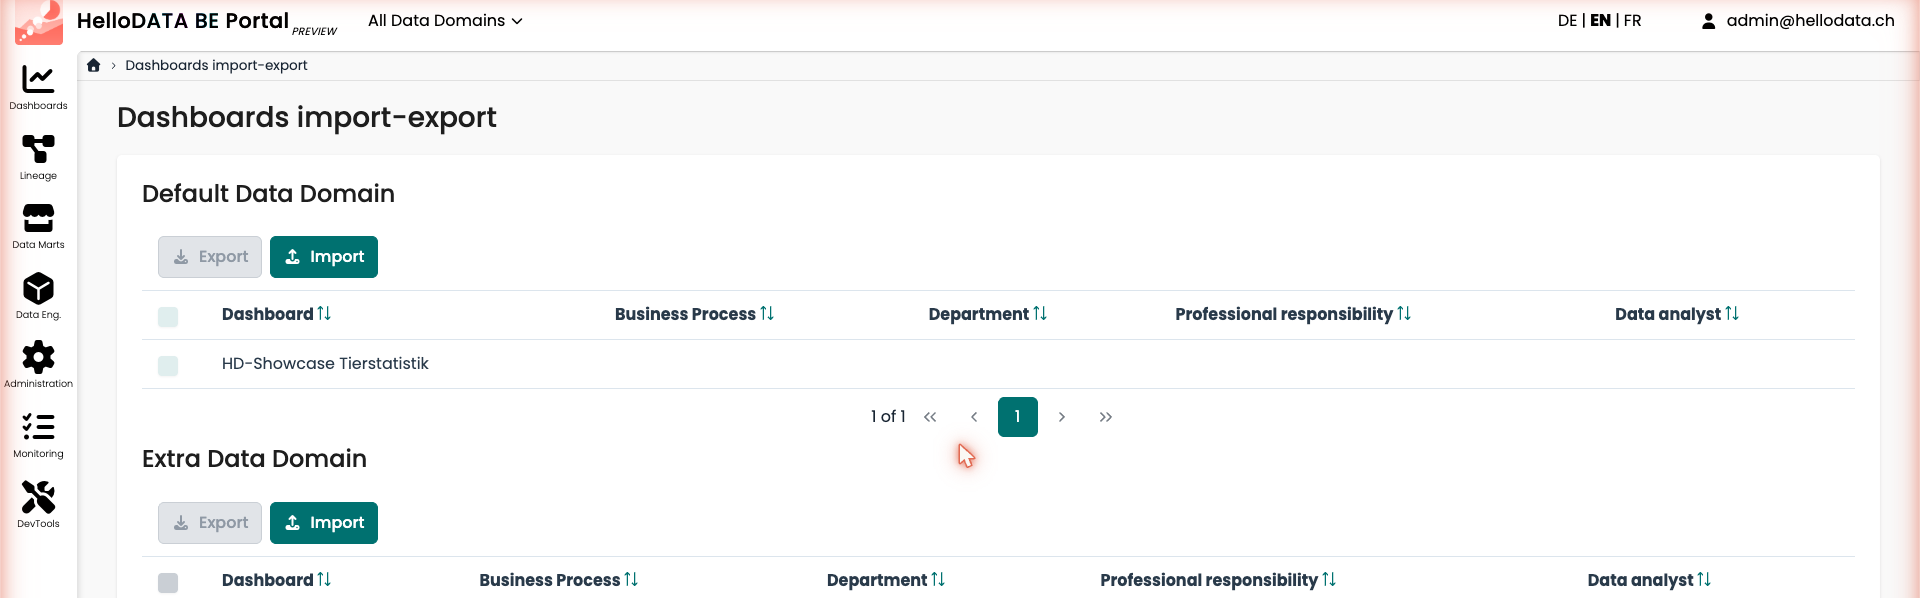
Dashboard Import / Export
The Dashboard import-export page lets administrators export dashboards from a data domain and import them into another. Each data domain has its own Export / Import controls and a table where you select the dashboards to transfer, together with their metadata (business process, department, professional responsibility, data analyst).
Monitoring
The Monitoring sidebar entry bundles the workspaces overview and the subsystem users.
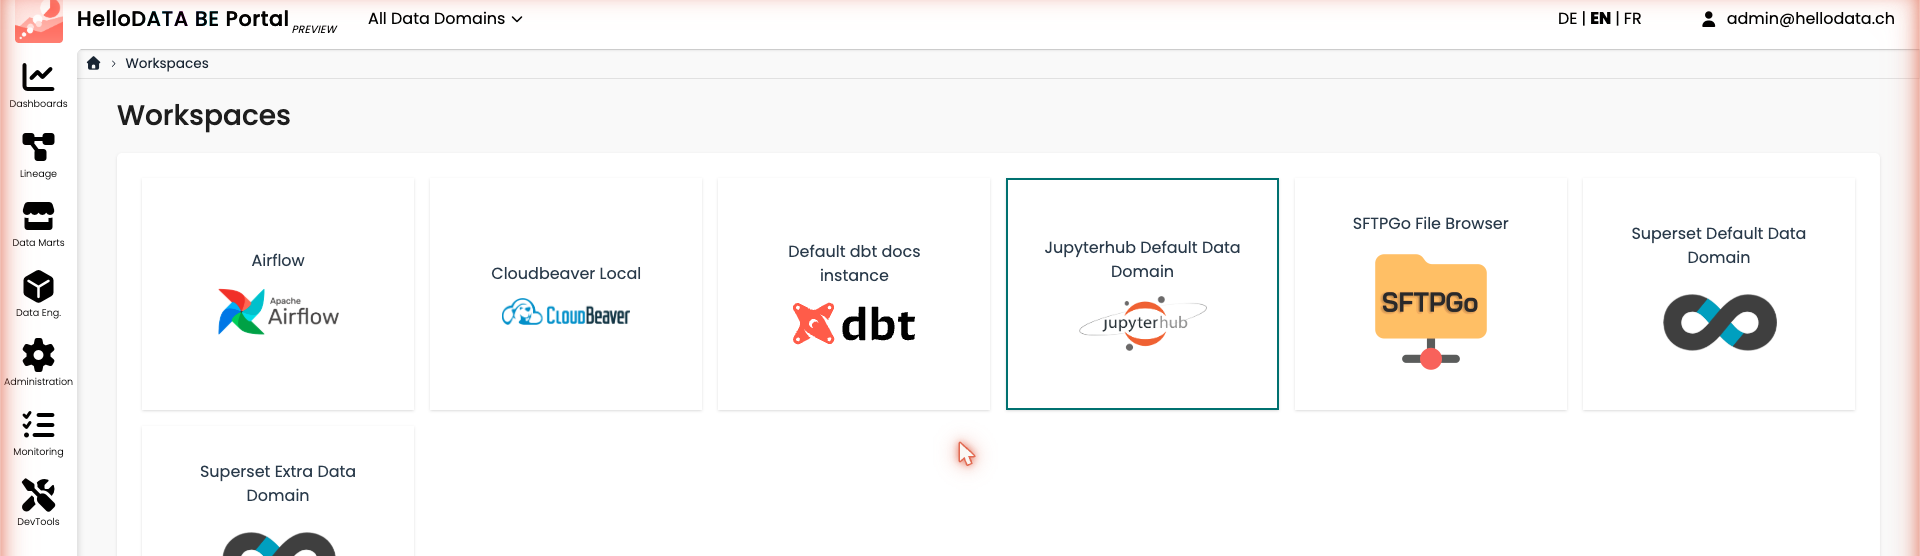
Workspaces
The Workspaces page gives you a single entry point to every connected subsystem and its native application — Airflow, CloudBeaver, dbt docs, JupyterHub, SFTPGo and the Superset instances per data domain. Click a card to open the corresponding tool.
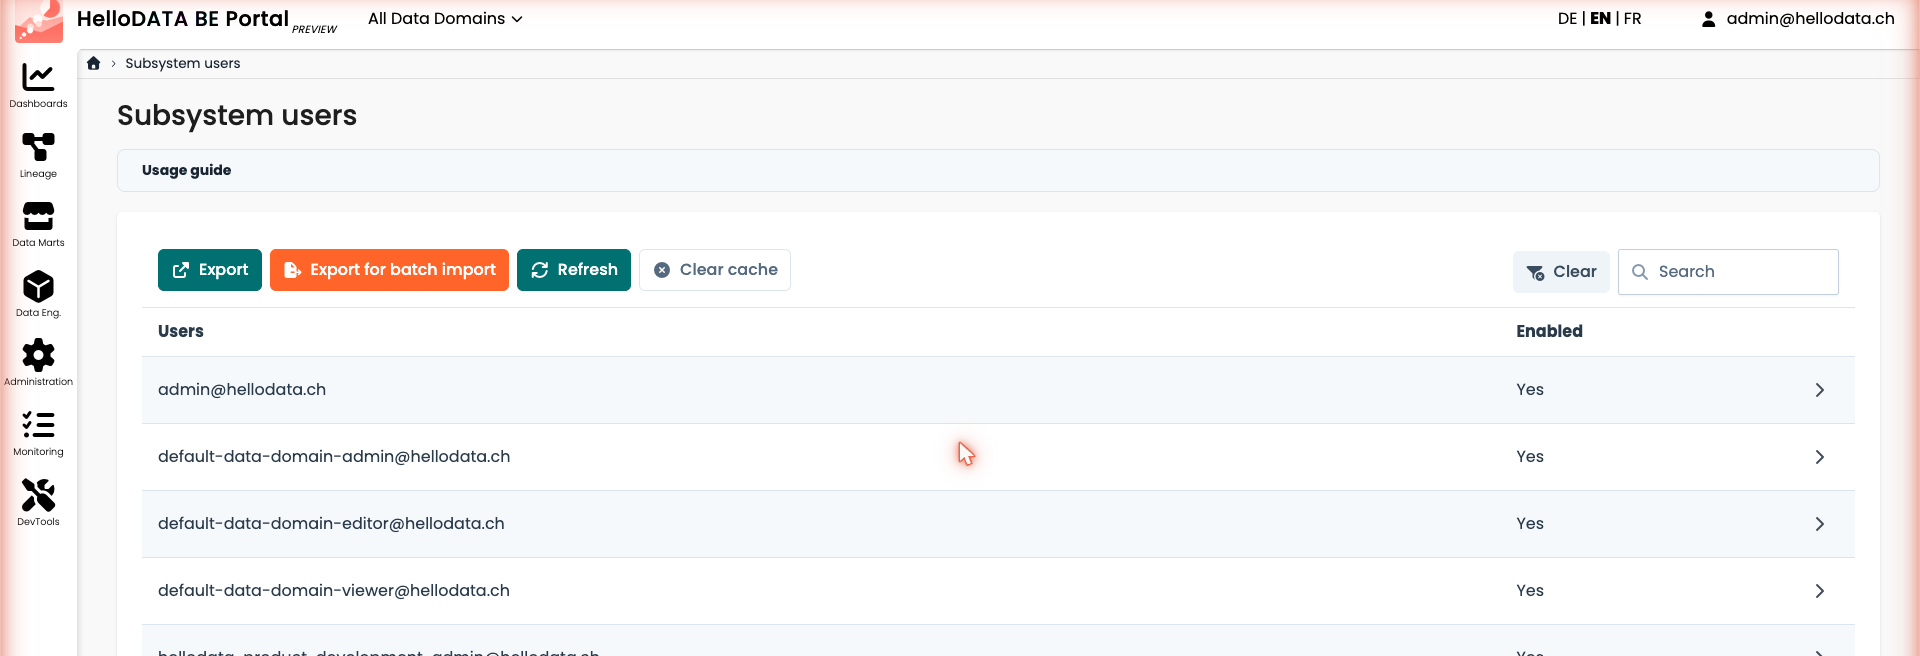
Subsystem Users
The Subsystem users page lets you observe and reconcile users across the connected subsystems. You can Export the list, Export for batch import, Refresh or Clear cache, and expand a user to see their state in each subsystem.
DevTools
DevTools are additional tools HelloDATA provides out of the box: the query history, a mailbox and a file browser.
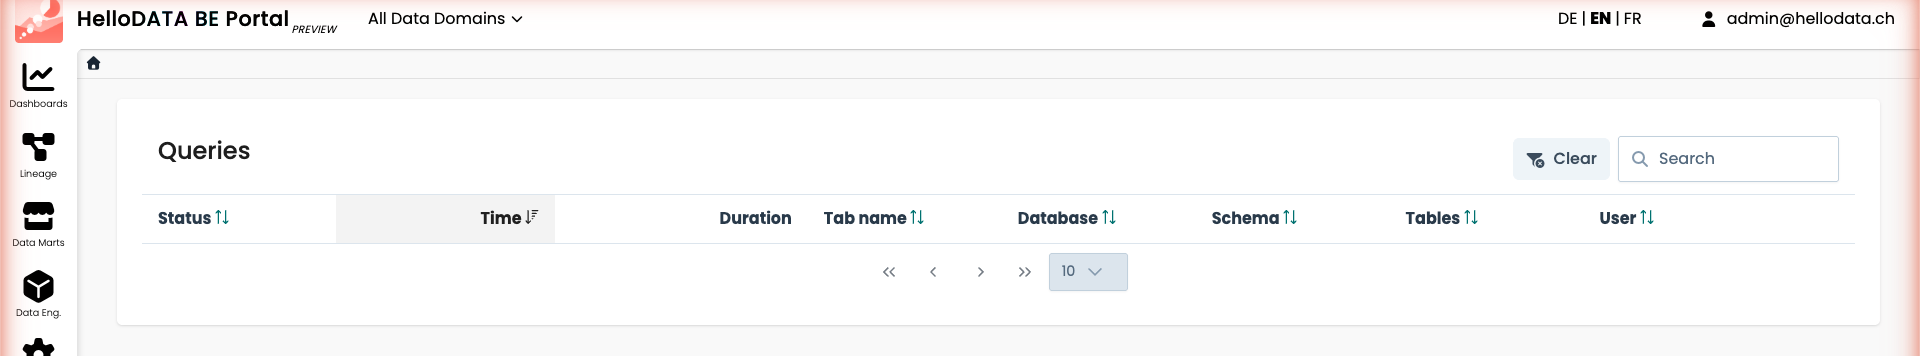
Queries
The Queries page shows the history of SQL queries executed against the data warehouse, with their status, time, duration, originating tab, database, schema, tables and the user who ran them.
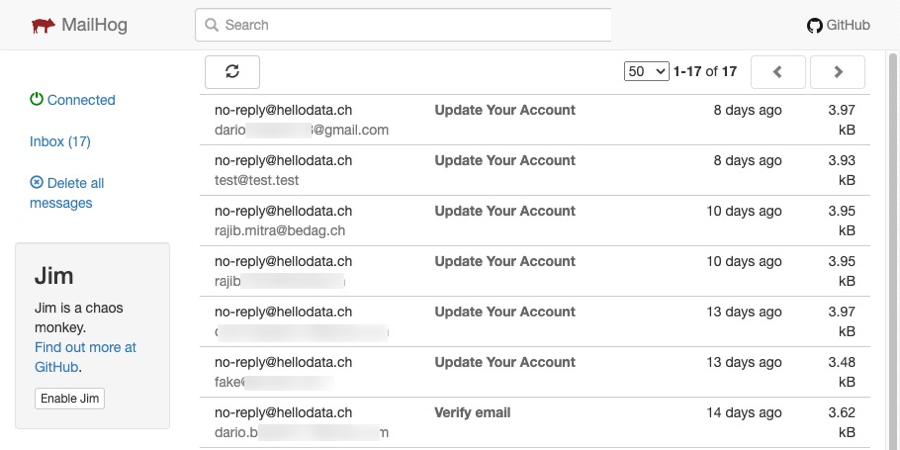
Mailbox
You can check in Mailbox (we use MailHog) what emails have been sent or what accounts are updated.
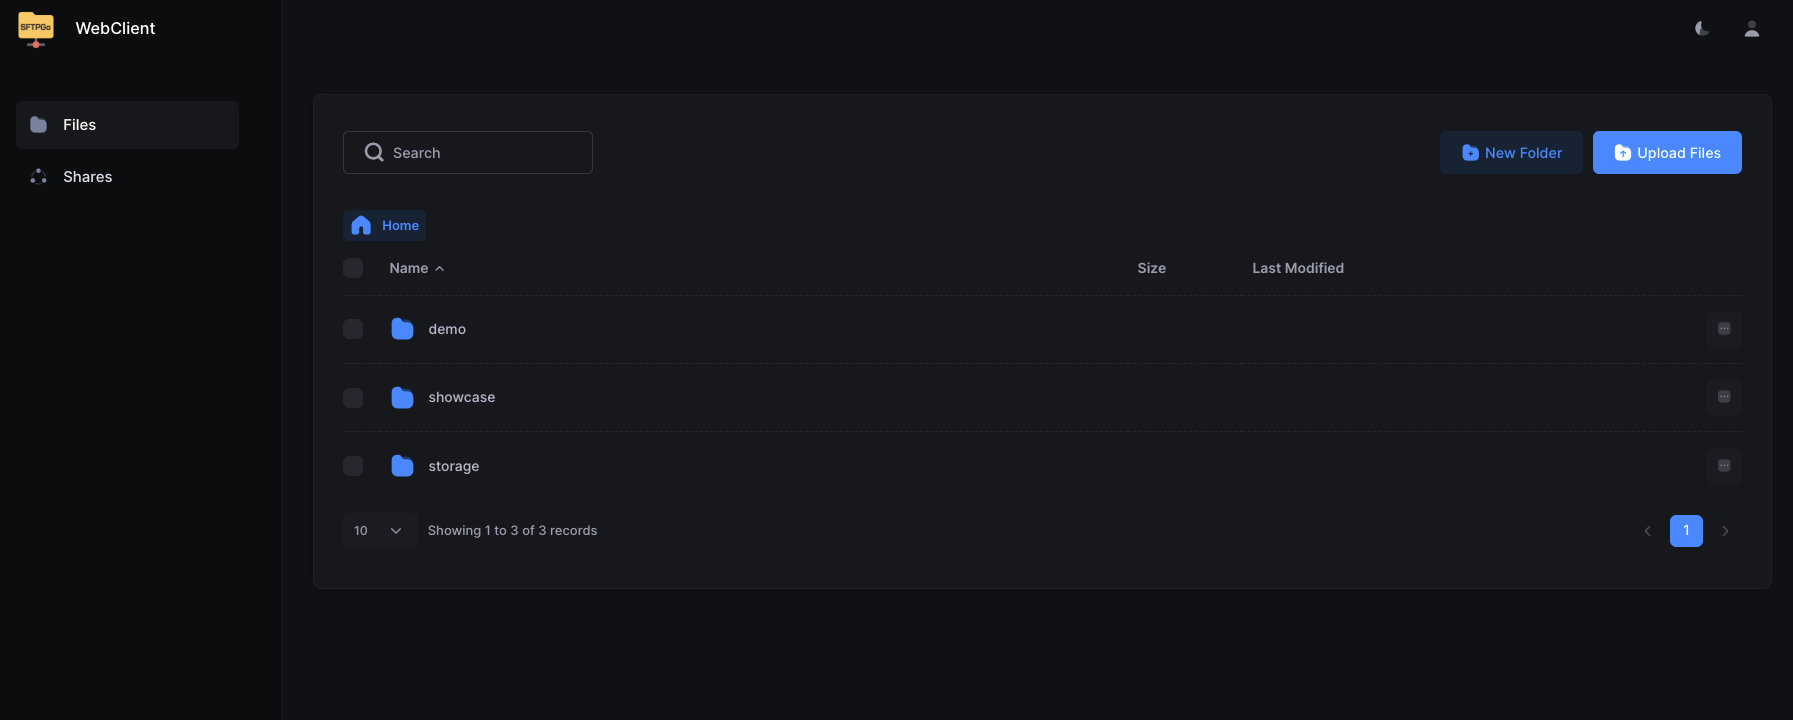
FileBrowser
Here you can browse all the documentation or code from the git repos as file browser. We use SFTPGo here. Please use with care, as some of the folders are system relevant.
Log in
Make sure you have the login credentials to log in. Your administrator should be able to provide these to you.
More: Know-How
- More help for Superset
- More help for dbt:
- More about Airflow
- More about SFTPGo
Find further important references, know-how, and best practices on HelloDATA Know-How.